Clojure Start-up Timings
Dec 26, 2017
In 2014 Nicholas Kariniemi wrote a series of articles on Clojure start-up and bootstrapping latency with a particular focus on Android. This article is my own investigation into Clojure start-up time on the desktop. Clojure as a language isn’t slow once it’s up and running but that start-up time has resulted in a handful of band-aids over what I consider to be a root-cause of slow start-up time. A lot of research has been carried out by Alex Miller and others at Cognitect on how to improve start-up time. The reality is for most people in the Clojure community its relative impact, the available workarounds, and potential for regression doesn’t justify investing serious engineering effort. There are a few areas where I think Clojure would benefit from faster start-up;
- Android development.
- Lambda functions.
- Dynamic Schedulers (e.g. Kubernetes, Nomad, GAE, Heroku).
In this article I’ll cover Clojure start-up time as demonstrated by the command below on the tracing branch in my fork of the Clojure repo.
1
2
java -cp clojure.jar:`cat maven-classpath` \
 clojure.main -e '(prn "hello")'
This command is a small Clojure app that prints “hello” and will output a trace log.
I will walk through Clojure start-up breaking it down into the following sections;
- JVM start-up.
- clojure.main/main.
- clojure.RT static.
- clojure/core.
- your code.
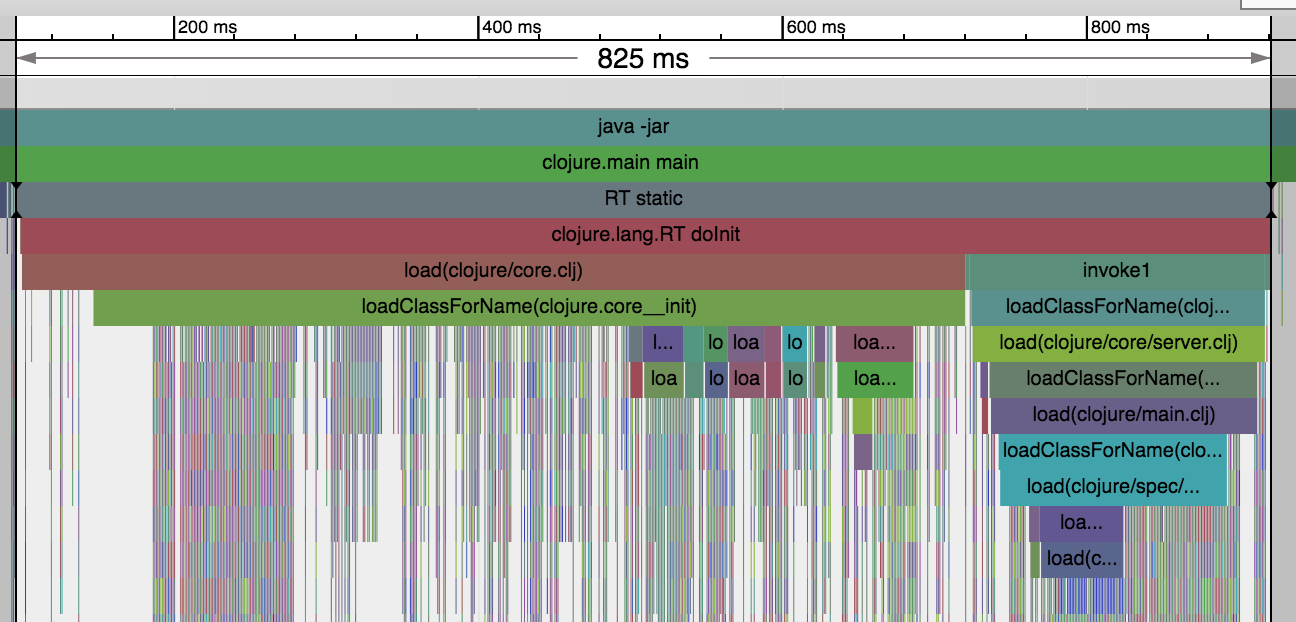
The following trace graph will be used as a visual aid.
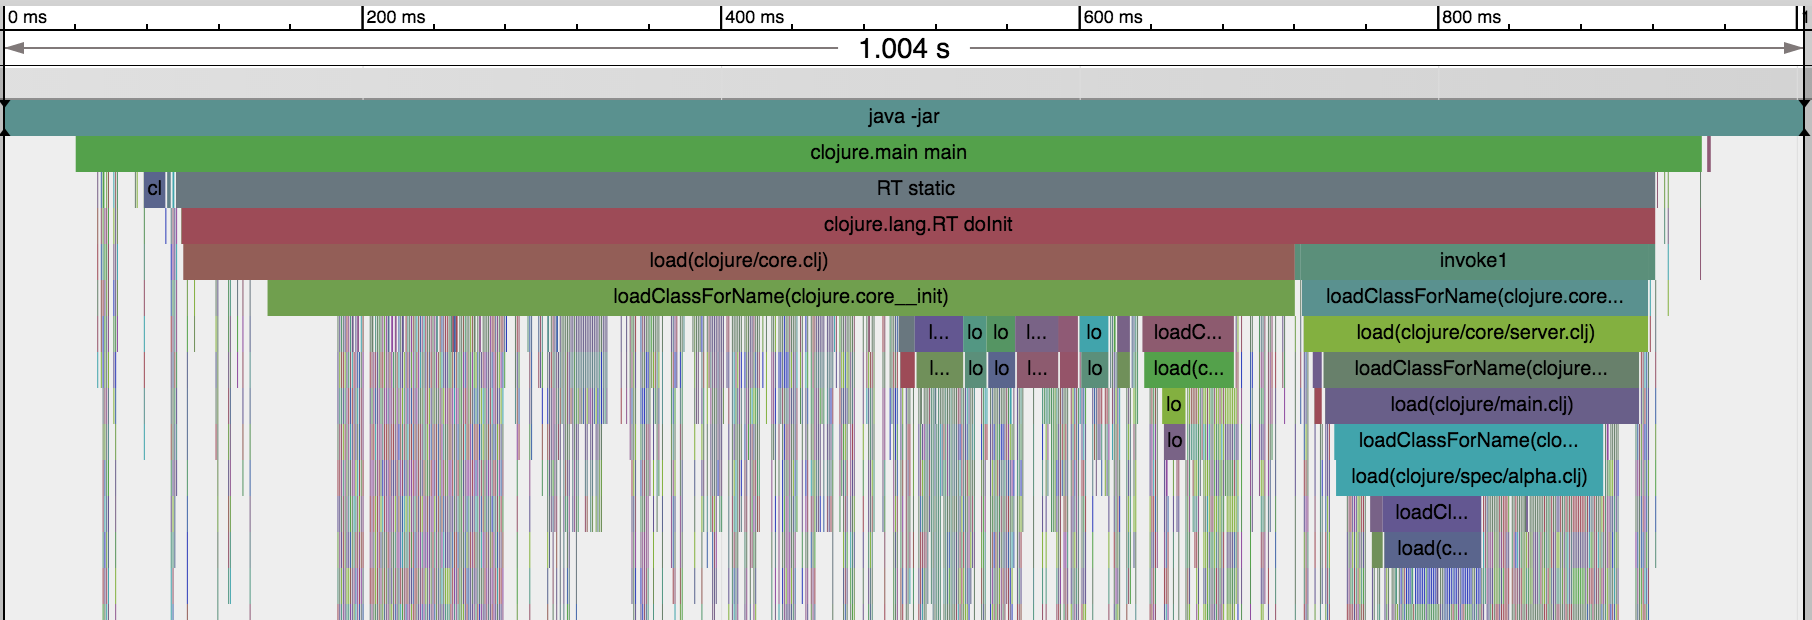
The first thing to callout is that because I’ve instrumented Keyword.intern,
Var.intern, and Symbol.intern it has impacted the total run time adding
about 70ms (7.5%). As a result the numbers throughout are meant to be used as
proportional rather than absolute measures. The ideal start-up would have as few
gaps on the above graph as possible and more work being done with-in a given
slot of time.
JVM Start-up
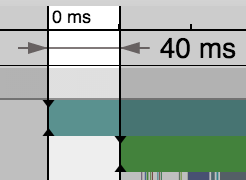
JVM start-up is a fixed cost of around 40ms on my machine as illustrated above.
During those first 40ms (4.2%) the JVM is initialised, and bootclasspath and extensions are loaded. It is therefore impossible for Clojure to load any faster than this and is probably wishful thinking to have it load in anything less than a multiple of this.
clojure.main/main
The next bit is loading clojure.main/main which is located in src/jvm/clojure/main.java. This is the clojure.main referenced from our command-line argument. It is a simple static Java main method that has the following code associated with it;
1
2
3
4
5
final Var REQUIRE = RT.var("clojure.core", "require");
final Var MAIN = RT.var("clojure.main", "main");
final Symbol CLOJURE_MAIN = Symbol.intern("clojure.main");

REQUIRE.invoke(CLOJURE_MAIN); MAIN.applyTo(RT.seq(args));
Behind those 5 lines is packed the whole of the Clojure run-time environment. In
the standard Clojure jar the vars and symbols are static fields in the main
class. This results in RT and clojure.core being initialised prior to
clojure.main/main being called. For illustration purposes I’ve
inlined
the fields into the main method as outlined above. This allows me to reduce the
queue size to 256 entries for my tracer and helps to highlight performance gaps
on the graph.
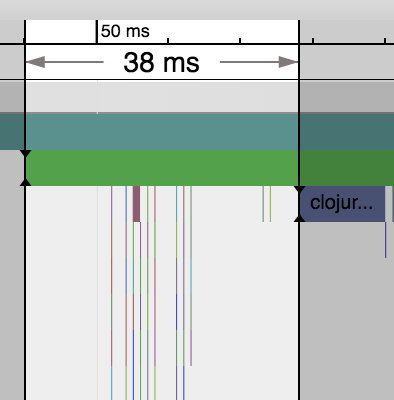
One of the things you’ll quickly notice is the 38ms (4.0%) gap between the start
of clojure.main/main and the execution of the clojure.RT static block. The first
12ms (1.3%) of empty whitespace is class loading at which point a small flurry
of about 100 clojure.lang.Symbols, Vars, and Keywords are created as highlighted
above until *out* is loaded 38ms (4.0%) later.
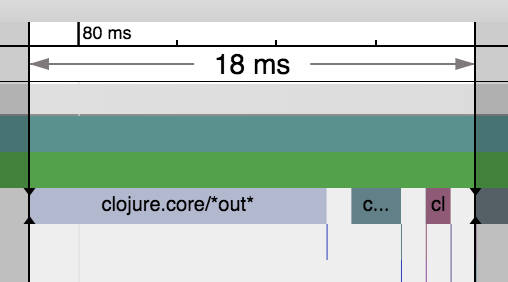
Clojure *out* in purple takes another 12ms (1.3%) and its symbol is the thin
green line 4ms (0.4%) earlier in the graph above. A large amount of this time is
associated with updating the Var
root
, the
CAS operations
used to add the Var, and adding the Var to the ns map. I have some concerns that
an AtomicStampedReference isn’t used
here
because of the ABA problem. I
doubt it’s much of an issue in practise because of the largely serial nature of
namespace initialisation and the employment of Var.rev. There’s an
issue
with syncronisation in the
constructor
that I plan to submit a patch for.
The next hiccup during this 18ms (1.9%) period is *in* which takes 2ms (0.2%)
and then finally *reader-resolver* which is 1ms (0.1%).
Why fuss over 18ms (1.9%)? The optimisation of start-up is unlikely to be achieved from a single silver bullet. Instead it will be the accumulation of many small optimisations. This is also a good spot to test optimisations prior to modifying how Clojure classes are generated.
clojure.RT static
Between the start of clojure.main/main and what I’m calling clojure.RT static in RT.java is the initialisation of a number of vars, symbols, and keywords used by the compiler and run-time.
The clojure.RT static block is the lion’s-share of latency in Clojure start-up and accounts for 825ms (87.2%) of the start-up time.
Alex Miller has cited you save ~50ms (~5.5%) by eliminating the load of the server class. This benefits compilation units but, doesn’t really help start-up when the server is required.
clojure.core
The best place to focus optimisations is going to be on the events that happen in clojure.core which represents 620ms (65.5%). The majority of time in this module is initialising the namespaces vars. The thin technicolor dreamcoat lines are symbols, vars, and keywords being initialised.
your code
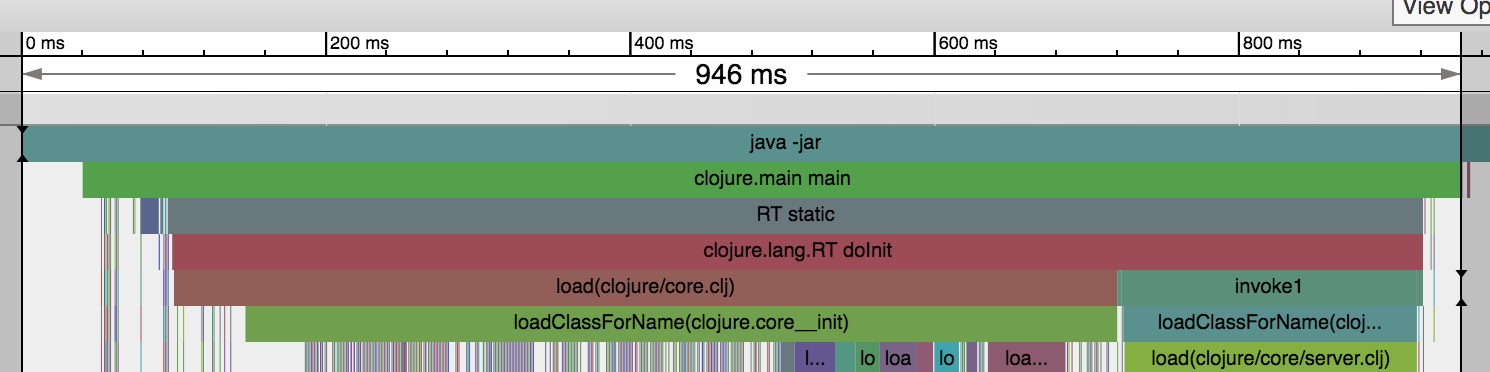
Finally the beginning of your code execution happens all the way over at 946ms. Hello prn invocation! Everything after this point is related to my tracer and JVM shutdown and can largely be ignored.
Conclusions
So the remaining question is “What’s a developer to do?”. How could we optimise Clojure start-up beyond what Alex Miller has already documented?
One of the first things you’ll notice if you load the trace in chrome://tracing is that everything is a single thread. Alex has already cited more efficient execution of vars and lazy loads as an opportunity ripe for optimisation. So here are a few options that I think might provide some additional improvements;
- As Clojure start-up is single threaded there should be a way to take advantage of that by using smart-batching to minimise some of the CAS spins that exist in Namespace.intern. This potentially requires changes to how AOT classes are generated to be effective.
- Create and analyse a call graph for all of the required symbols, vars, and keywords associated with a given entry point (e.g. clojure.main) and only load the dependencies for that call graph. Clojure being a dynamic language could yield some tricky edge-cases but for clojure.core it should be “relatively” straightforward (I’m sure that’ll be on my gravestone).
- “Prefetching classes” in a thread spawned by clojure.main/main. In the JVM class loads are loaded serially by standard class loaders and can be expensive. By loading the classes into the code cache before they’re used it will help close some of the white-space gaps in the graph.
- Precompiling a chunk of the clojure runtime or app using jaotc and the base java module to see whether that has any positive impacts.
I’ve started on some of these optimisations and plan to post a follow-up with my findings.
Thanks
Special thanks to Simon Stewart and Paul Hammant for their valuable input to this article.
tags: [ clojure ]